

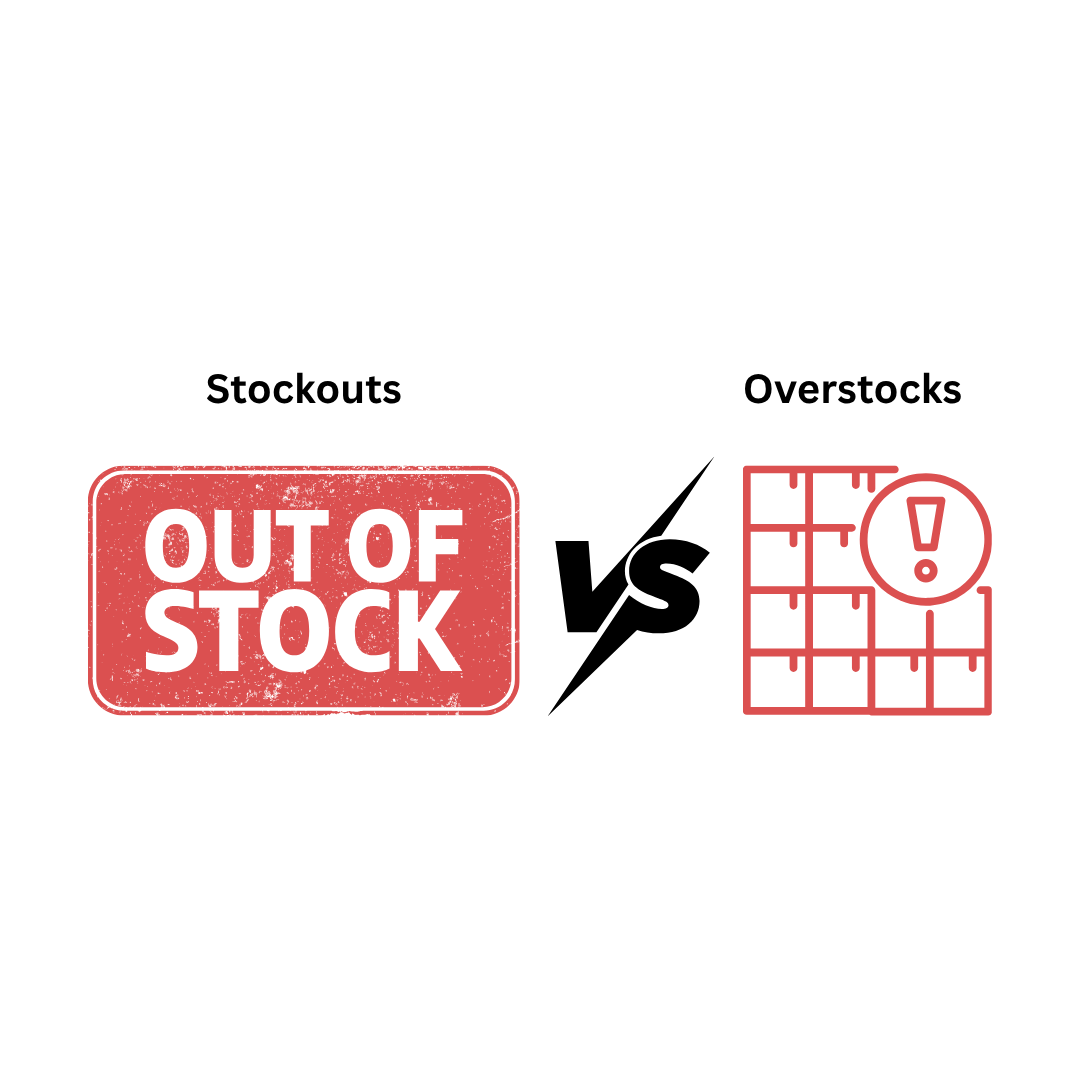

Stockouts and Overstocks
EDI prevents stockouts and overstocks by automating the exchange of inventory, order, and sales data between trading partners in near real time. Standardized transactions such as EDI 846, 852, 850, and 856 keep stock counts, demand signals, and shipment status synchronized across your ERP, WMS, and every sales channel, so replenishment runs on current data instead of a spreadsheet somebody exported last Tuesday.
Key Takeaways
- Inventory distortion is a $1.73 trillion problem. Out-of-stocks and overstocks together cost global retail roughly 6.5% of sales, and supply chain disruption alone accounts for $301 billion of it (IHL Group, 2025).
- Real-time data beats batch files. When a sale posts, EDI pushes the new stock position to trading partners and channels within minutes instead of overnight, which closes the window where two customers can buy the same last unit.
- Automated reorder points remove the human bottleneck. Scheduled ERP queries check every SKU against its reorder point on a fixed cadence, and the open purchase order check stops two buyers from ordering the same shortage twice.
- Marketplace penalties make sync a compliance issue. Amazon deactivates seller-fulfilled offers above a 2.5% cancellation rate and Walmart expects under 2%, so an inventory feed that lags is a direct account risk, not just a service problem.
- Demand signals arrive as transactions, not guesses. EDI 852 product activity data, EDI 830 planning schedules, and EDI 862 shipping schedules give you store-level sell-through and forward demand you can plan against.
- The cost case is documented. The GS1 UK and Cranfield study of the UK grocery sector put EDI savings at £14 per order and £8.50 per invoice against manual processing, totalling roughly £650 million a year across that one sector (GS1 UK / Cranfield School of Management).
What Do Stockouts and Overstocks Actually Cost?
Stockouts and overstocks are the same failure measured from two directions: your stock position does not match real demand. IHL Group, which has tracked this for nearly two decades, puts the combined worldwide cost at $1.73 trillion a year, or about 6.5% of global retail sales. Out-of-stocks account for roughly $1.2 trillion of that and overstocks for about $572 billion.
The consumer side has been measured since 2002, when Gruen, Corsten and Bharadwaj surveyed more than 71,000 shoppers across 29 countries for the Grocery Manufacturers of America. They found a global shelf out-of-stock rate of 8.3%. When shoppers hit an empty shelf, about 31% bought the item at another store and about 9% did not buy at all. Corsten and Gruen later estimated in Harvard Business Review that stockouts cost a typical retailer around 4% of sales, roughly $40 million a year for a billion-dollar chain. Two decades on, the 8.3% figure has barely moved.
Overstock is the quieter half. US businesses were sitting on $2.71 trillion of inventory at the end of March 2026, against an inventory-to-sales ratio of 1.32 (US Census Bureau, Manufacturing and Trade Inventories and Sales). Every point of that ratio is working capital that cannot be spent on anything else, plus storage, insurance, shrink, and eventual markdowns.
What follows are eight specific mechanisms by which EDI in supply chain management moves stock positions closer to actual demand, with the transaction sets involved in each.
1. Real-Time Inventory Tracking Through EDI
EDI keeps inventory records current by transmitting stock changes to trading partners as events occur rather than in overnight batches. When a unit sells, ships, or is received, the EDI 846 Inventory Inquiry/Advice carries the new position to buyers and channels within minutes, so replenishment decisions and channel availability reflect what is actually on the shelf.
How the Data Moves
The mechanism is unglamorous. Your ERP or WMS emits an inventory position. Your EDI translator maps it to the trading partner’s required format. Your value added network delivers it. The partner’s system consumes it without anybody rekeying a number. The document doing most of the work here is the EDI 846 Inventory Inquiry/Advice, which communicates on-hand quantities by item and location.
The difference between batch and event-driven transmission is the size of the window in which your systems can be wrong. A nightly file means your Amazon listing and your warehouse can disagree for up to 24 hours. A feed triggered on each stock movement narrows that to minutes. Neither is instant, and anyone claiming true real-time EDI is describing an API, but the gap between the two is where oversells and phantom stockouts live.
What Accurate Stock Positions Let You Do
- Set replenishment triggers against current stock rather than a position that was true yesterday morning.
- Give suppliers visibility of your consumption so they can build to it instead of reacting to a rush order.
- Spot a slow-moving SKU while there is still time to reallocate it, not after it has been sitting for a quarter.
- Reconcile system stock against physical stock more often, because the data arrives in a structured format you can compare automatically.
Three transaction sets are commonly confused here. The EDI 832 defines the item and price catalogue, the 846 reports availability, and the 947 corrects the book record after a physical count. Commport has a breakdown of how EDI 832, 846, and 947 work together if you need to decide which ones your partners will require.
Where Alerts Fit
Once positions are current, threshold alerts become reliable. Configure a floor per SKU, and the system flags the breach as soon as the position crosses it rather than when somebody next opens the report. That shifts replenishment from a scheduled review to an exception process, which is the single biggest workload change most teams notice after automating inventory management with EDI.
2. Automated Reorder Point Management
A reorder point is the stock level at which replenishment must start for the order to arrive before you run out. Automating it means a scheduled job compares every SKU against its reorder point, checks whether a purchase order is already open, and raises an EDI 850 to the preferred supplier when both conditions are met. No report review, no forgotten SKU.
EDI-Driven Reorder Alerts
An automated reorder cycle does four things every time it runs, typically hourly or once daily depending on velocity:
- Query current on-hand quantity for every active SKU from the ERP.
- Add quantity already on order, then compare the total against the configured reorder point.
- Check for an open purchase order on any item that fails the test, so a pending shipment does not trigger a duplicate.
- Generate the order for genuine shortfalls, pulling the order quantity, preferred supplier, and contract price from the item master.
Step three is the one that saves money. Manual replenishment produces duplicate orders when two buyers notice the same shortage independently, and the fix is not training; it is a system that will not raise a second order against an open one. The output is a standard EDI 850 purchase order; the supplier responds with an EDI 855 purchase order acknowledgement confirming quantities and dates, which closes the loop on whether the shortage is actually being covered.
Manual Review Versus Scheduled Query
Dimension | Weekly manual report review | Automated EDI and ERP query |
Detection cadence | Once per week, subject to who is in the office | Hourly or daily, unaffected by absence |
Missed breaches | Items get skipped when report volume is high | Every SKU checked on every run |
Duplicate orders | Common when two buyers act on the same shortage | Prevented by the open purchase order check |
Reorder point updates | Static until somebody revisits them | Recalculated from live lead time and demand data |
Staff time | Hours per week on monitoring | Time spent on exceptions and supplier negotiation |
Setting the Thresholds
A reorder point is average demand during lead time plus safety stock. Both inputs move.
Lead times stretch during peak season and contract; demand shifts with promotions and weather. Static thresholds set once at implementation are the most common reason automated replenishment underperforms.
Recalculate them from rolling transaction history, and revisit them whenever a supplier’s actual delivery performance diverges from the contracted lead time. If you are running EDI in procurement, that performance history is already sitting in your transaction archive.
Smaller operations do not need an enterprise deployment to get this. A cloud EDI solution handles the document exchange through a browser while the reorder logic stays in your accounting or inventory system.
3. Demand Forecasting and Planning with EDI Data
EDI carries forward-looking demand as structured transactions. Retailers send EDI 852 product activity data with store-level sell-through, EDI 830 planning schedules with projected requirements by week or month, and EDI 862 shipping schedules with short-term releases. That gives planners actual downstream consumption instead of inferring demand from their own order history.
The EDI Transactions That Carry Demand
Transaction | What it tells you | Typical cadence |
Units sold, on hand, on order and returned, by item and store | Daily or weekly | |
Forecast requirements by period, sometimes with firm release windows | Weekly or monthly | |
Short-term ship instructions that adjust an existing 830 | Daily to weekly | |
Committed demand, used for planning by some partners and spot buys by others | Per order | |
Partner-side availability, useful for spotting downstream buildup | Daily |
The distinction that matters operationally: an 850 tells you what a partner has bought, while an 852 tells you what their customers have bought. Those two numbers diverge whenever a retailer is building or drawing down its own buffer, and planning against the wrong one is how a supplier ends up producing into a channel that is already full. Vendor-managed inventory programmes exist precisely to close that gap, and they run on 850 and 852 data (see the Commport glossary of terms for the full definition).
Seasonal and Regional Patterns
Store-level sell-through history lets you compare this year against last year by week, region, and item, rather than working from a national monthly total. Two things fall out of that comparison:
- When each season actually starts in each region, which in weather-sensitive categories can vary by several weeks across a single country.
- Which locations are drawing down faster than plan and which are sitting on cover, so you can move stock between them before either becomes a problem.
Peak periods concentrate the risk. There is one chance to sell through a seasonal assortment, and a forecast that is wrong in the second week cannot be corrected in the fourth. That is why EDI in the retail industry tends to be adopted first by categories with short selling windows.
Aligning Inventory with Forecasts
Vendors in this category, Commport included, publish figures such as a 19% improvement in forecasting accuracy after EDI integration. Treat those as vendor-reported rather than independently audited. The defensible statement is narrower and still useful: EDI replaces estimated downstream demand with reported downstream demand, and forecasts built on reported data outperform forecasts built on inference. How much they outperform depends on your category, your lead times, and how volatile your demand already was.
4. Multi-Channel Inventory Synchronization
Multi-channel sync works by holding one authoritative stock count and pushing every change out to all connected channels. When a unit sells on any channel, the central count decrements and the new figure is transmitted to the others. EDI 846 carries that update to marketplace and retail partners, which stops the same unit from showing as available in three places at once.
Why Overselling is a Compliance Problem, Not Just a Service One
If you sell the same pool of units on Amazon, Walmart Marketplace, and your own store, unsynchronized inventory guarantees oversells. The consequences are written into marketplace policy:
- Amazon: sellers are expected to keep the pre-fulfilment cancellation rate under 2.5% over a rolling seven-day window. Above that, seller-fulfilled offers can be deactivated (Amazon Seller Central). At 40 orders a week, a single cancellation puts you at the limit.
- Walmart Marketplace: the seller cancellation rate must stay below 2%, alongside a 99% valid tracking rate and 95% on-time delivery (Walmart seller performance standards).
- eBay: a transaction defect rate above 2% moves a seller to Below Standard, which brings reduced visibility and selling restrictions (eBay Seller Performance).
Amazon’s own guidance to sellers on how to fix a high cancellation rate is to update inventory more often to avoid taking orders you cannot ship. That is a description of the problem EDI solves. Commport covers the document flow for each major platform in its guide to connecting e-commerce stores to major marketplaces
Event-Driven Sync Versus Polling
The sync interval decides how bad a peak-trading day gets. A feed that refreshes every 30 minutes is adequate at steady volume and inadequate during a flash sale, because the entire allocation of a hot SKU can sell out across three channels inside one polling gap. Event-driven updates, triggered by the sale itself, do not have that failure mode. Where a partner will only accept scheduled EDI files, shorten the interval on your fastest-moving SKUs and hold a buffer against the rest.
This is the same architecture that underpins omnichannel capability for retailers: one stock truth, standardized data movement, every channel reading from the same position rather than keeping its own.
5. Supplier Communication and Lead Time Optimization
EDI compresses lead time by removing the queue time between steps. An order that would wait for a fax, a keying session, and a callback moves supplier to buyer in minutes. The 850, 855, 860, 856, and 997 transaction chain also makes each step observable, so a delay surfaces as a missing acknowledgement rather than as a shipment that never arrives.
The Order Lifecycle, Transaction by Transaction
Step | Transaction | What it prevents |
Buyer places order | Keying errors and postal or fax delay | |
File receipt confirmed | EDI 997 Functional Acknowledgement | Orders lost in transmission without anyone noticing |
Supplier responds | Assuming an order is accepted when it is short-shipped or rejected | |
Buyer amends order | Phone-call changes that neither side has in writing | |
Supplier ships | Blind receiving and unplanned dock congestion | |
Supplier invoices | EDI 810 Invoice | Disputes from invoices that do not match the amended order |
The 997 and the 855 are frequently conflated and should not be. The 997 confirms a file arrived and was structurally valid. The 855 confirms a human or system on the other side accepted the business content. Commport’s explainer on the EDI purchase order and purchase order acknowledgement sets out the distinction and why large retailers require both.
The ASN is the Lead-Time Lever
The advance ship notice does the most for inventory planning. It tells the receiving warehouse what is on the truck, how it is packed, and when it lands, before it arrives. That converts receiving from discovery into verification, and it lets planners commit inventory that is still in transit. The EDI 856 transaction is the North American standard for this; DESADV is the EDIFACT equivalent. Commport’s guidance on EDI in warehousing covers how it interacts with 940 and 945 warehouse documents.
Onboarding Speed is Part of Lead Time
When a supplier becomes cost-prohibitive or unreliable, the constraint on switching is rarely finding an alternative. It is how long it takes to get the alternative trading electronically. Standardized transaction sets and an established VAN interconnect make that a matter of weeks rather than a quarter. If your internal team is the bottleneck, managed EDI services shift partner onboarding to a provider who does it continuously. Suppliers approaching this from the other direction should start with EDI for suppliers.
6. Safety Stock Level Calculations
Safety stock is the buffer that absorbs demand and lead time variability. Calculating it well requires an accurate, granular history of both. EDI transaction archives supply exactly that: every order date, acknowledged date, ship date, and receipt date, per supplier and per item, which is what the statistical formulas need as inputs.
The Inputs the Formulas Need
Safety stock requirements are driven by service level target, lead time, demand volatility, order policy, component commonality, and holding costs (peer-reviewed research, PMC). Most organizations estimate several of these because the underlying data sits in email threads and delivery notes. An EDI archive gives you dated, structured records of every one of them.
Two Ways to Calculate it
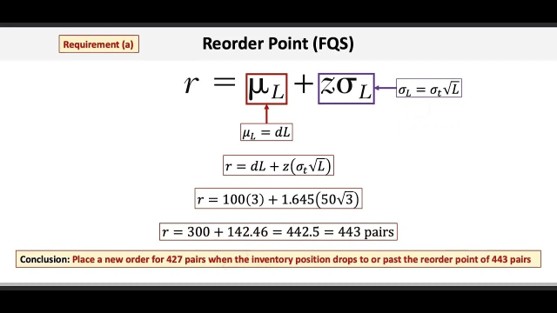
The simple approach uses observed extremes: maximum daily usage multiplied by maximum lead time, minus average daily usage multiplied by average lead time. With peak daily sales of 100 units against a 7-day worst-case lead time, and averages of 60 units against 5 days, that gives 400 units of safety stock. It is easy to compute, and it over-buffers because it treats the worst observed case as the planning case.
The statistical approach multiplies a service factor by the standard deviation of demand during lead time. A 95% cycle service level corresponds to a Z-score of 1.65 (King, “Crack the Code: Understanding Safety Stock and Mastering Its Equations”). The relationship is not linear: moving from 95% to 98% service costs disproportionately more inventory than moving from 90% to 95%, because the service factor climbs faster than the service level (Journal of Public Administration, Finance and Law). Deciding where to stop on that curve is a margin decision, not a supply chain one.
Where EDI Moves the Number
Better inbound visibility reduces the buffer you need. Commport’s own analysis of purchase order automation reports that reliable advance shipment data lets businesses trim safety stock by around 5%, because in-transit inventory becomes plannable rather than uncertain (vendor-reported figure; see EDI purchase order and acknowledgement). The mechanism is sound regardless of the exact percentage: variability you can see is variability you do not have to buffer against blindly.
Static safety stock set once a year and left alone is the common failure. Recalculate on a rolling window so the buffer widens when a supplier’s delivery performance degrades and narrows when demand settles. EDI transaction history is what makes that recalculation possible without a data-gathering project each time.
7. Identifying and Managing Slow-Moving Inventory
Slow-moving stock is easier to prevent than to clear. EDI supplies the turnover data that flags it early: shipment frequency per item, sell-through against forecast, and days of cover by location. Products whose replenishment interval is lengthening are decelerating, and that signal arrives weeks before the holding cost shows up in the accounts.
The Signals Worth Watching
- Lengthening replenishment interval. An auto-replenished item that used to ship weekly and now ships fortnightly is losing velocity, whatever the forecast says.
- Sell-through below forecast for consecutive periods. One bad week is noise. Three is a trend, and three weeks is still early enough to act on.
- Divergence between locations. The same SKU at 12 days of cover in one region and 90 in another is a distribution problem, not a demand problem.
- Rising holding cost share. When storage cost per unit sold climbs for a specific item, that item is sitting.
Warehouse transactions carry most of this. The EDI 945 Warehouse Shipping Advice confirms what actually left the building, which is the ground truth against which forecasts should be judged. Where a third party runs the facility, 3PL B2B integration is what makes those confirmations visible in your own systems at all. Commport’s overview of distribution centre types sets out how the 940 and 945 pair works in outsourced operations.
Acting on it
Reallocation beats liquidation whenever it is available. Moving units from a location with 90 days of cover to one with 12 recovers full margin and costs only freight. Once reallocation is exhausted, the options descend in order of margin retained:
- Bundle the slow item with a fast-moving one, which moves units without publishing a lower price for the item itself.
- Run a time-boxed promotion, which accelerates sell-through without resetting the everyday price.
- Sell in bulk to wholesale or off-price buyers, which clears volume fast and recovers less per unit.
- Write down and dispose, which recovers warehouse space and stops the holding cost.
Whichever route you take, the value of the EDI data is that it gives you the choice earlier. Integrating EDI with your WMS and with your ERP is what turns turnover reporting from a monthly exercise into a continuous one.
8. Cost Savings and ROI from EDI Implementation
The return comes from three places: recovered sales that would have been lost to empty shelves, working capital released from excess stock, and per-transaction processing cost that disappears when documents stop being handled by people. The GS1 UK and Cranfield study quantified the third at £14 per order and £8.50 per invoice.
Sizing the Lost Sales
The arithmetic is simple. Multiply expected daily units by unit price by days out of stock. A line selling 10 units a day at $25 that is unavailable for 5 days costs $1,250 in direct revenue. That understates the damage, because roughly 31% of shoppers who hit an empty shelf buy the item somewhere else (Gruen, Corsten and Bharadwaj, GMA), and some of them do not come back.
At portfolio level, work from fill rate. If in-stock performance runs at 92% and each percentage point of unavailability costs you roughly half the sales that would otherwise occur in that period, then a company doing $100 million a year is leaving around $4 million on the table. Improving fill rate by two points against that model recovers roughly $1 million of annual revenue, which is the number to weigh against the incremental inventory and system cost of getting there.
The Documented Processing Savings
The most-cited independent measurement of EDI processing savings remains the GS1 UK EDI Cost Savings Report, produced in collaboration with the Cranfield School of Management. Across roughly 27 million annual orders in the UK grocery sector, it found savings of £14 per order, £8.50 per invoice, and £12 per despatch advice against manual handling, totalling around £650 million a year (coverage of the report findings). At the time of the study, 84% of retailer orders and 87% of invoices were already electronic, but only 38% used electronic despatch advice, leaving an estimated further £200 million unclaimed.
Emergency Procurement is the Hidden Line
Expedited orders carry premiums that rarely appear as a single line on a P&L: air freight instead of ocean, spot pricing instead of contract, overtime in receiving, and the staff hours spent chasing the shipment. Emergency procurement happens when the shortage was not seen coming. Every mechanism in this article is designed to see it coming, which is why procurement savings usually outweigh document-processing savings in practice, even though the document-processing savings are the ones that are easy to quantify.
For a view of the cost side of running EDI itself, Commport’s comparisons of EDI VAN services and EDI outsourcing set out the trade-offs between in-house operation and a managed model.
Comparison Table: 8 Ways EDI Prevents Stockouts and Overstocks
Each method addresses a different failure mode. Most organizations implement them in roughly the order below, because each one depends on the data quality established by the one before it.
# | Method | Core transactions | Prevents stockouts by | Prevents overstocks by |
1 | Real-time inventory tracking | 846, 856 | Flagging threshold breaches as they happen | Keeping positions accurate so nobody reorders blind |
2 | Automated reorder points | 850, 855 | Checking every SKU on every run, not weekly | Blocking duplicate orders against open POs |
3 | Demand forecasting | 852, 830, 862 | Planning against downstream sell-through | Stopping production into a channel already full |
4 | Multi-channel synchronization | 846, 850 | Keeping channel availability truthful | Removing the buffer held to absorb sync lag |
5 | Supplier and lead time optimization | 850, 855, 860, 856, 997 | Compressing order-to-receipt time | Reducing the cover needed for long lead times |
6 | Safety stock calculation | Full transaction archive | Sizing the buffer to real variability | Trimming buffer where variability is low |
7 | Slow-moving inventory analysis | 852, 945 | Freeing capital for items that sell | Catching decelerating items weeks earlier |
8 | Cost and ROI measurement | All of the above | Justifying the fill-rate investment | Quantifying the carrying cost being avoided |
Where Should You Start?
Sequence matters more than scope. Attempting all eight at once is how EDI projects stall.
- Get the core four transactions working with your largest partner: 850 in, 855 out, 856 out, 810 out. This is the compliance baseline nearly every major retailer requires.
- Add 997 monitoring so you find out about failed transmissions from an alert rather than from a chargeback.
- Turn on 846 inventory feeds to the partners and channels that accept them. This is the single change that most reduces oversells.
- Request 852 product activity data from retail partners. Many will provide it and never mention it unless asked.
- Automate reorder point checking against the ERP once the data feeding it is trustworthy.
- Rebuild safety stock from the transaction archive you now have, and set it to recalculate on a rolling window.
Which deployment model fits depends on volume and internal capacity. Commport Integrated EDI connects directly to your ERP, accounting, or WMS for higher-volume operations. Commport Cloud EDI handles document exchange through a browser for lower volumes or newer trading relationships. The Commport Value Added Network carries the traffic either way. Commport’s overview of the types of EDI and its complete guide to EDI for retail, e-commerce, and 3PL providers cover the selection criteria in more detail.
Conclusion
Stockouts and overstocks are not two problems. They are one problem, which is that your stock position and actual demand have drifted apart, and the only durable fix is shortening the distance between when something happens in the market and when your systems know about it.
That is the whole case for EDI in inventory management. Real-time positions, automated reorder checks, downstream sell-through data, synchronized channels, shorter lead times, statistically sized buffers, and early warning on slow movers all do the same job from different angles. None of them is exotic. Most of them use transaction sets that have been standardized for decades and that your largest trading partners already require you to support.
The question worth asking is not whether to adopt EDI. If you sell into major retail, that decision has been made for you. The question is whether you are using the data those transactions already carry, or whether your 852 files are landing in a directory nobody reads. Start with Commport’s guide to automating inventory management with EDI, then work through the sequence above.
Talk to Commport About Inventory Visibility
Need Help? Download: Commport's EDI Buyers Guide
Unlock the full potential of your supply chain with our comprehensive EDI Buyer's Guide — your first step towards seamless, efficient, and error-free transactions
Frequently Asked Questions
EDI in inventory management is the automated exchange of inventory data between trading partners using standardized electronic messages. Instead of emailing spreadsheets or rekeying stock counts, systems exchange documents such as the EDI 846 Inventory Inquiry/Advice directly, so both sides work from the same numbers without manual handling.
The core set is EDI 846 for inventory availability, EDI 852 for product activity and sell-through, EDI 850 and 855 for orders and acknowledgements, EDI 856 for advance ship notices, and EDI 947 for inventory adjustments. Warehouse operations add EDI 940 and 945 for shipping orders and shipping advice.
EDI gives near real-time visibility, typically minutes rather than seconds. Event-driven EDI transmits a stock change as soon as it happens, which is fast enough for most replenishment and channel-sync decisions. If you need true instant updates between two systems, an API integration is the right tool, and many businesses run both.
EDI keeps one authoritative stock count and pushes each change to every connected channel, so the same unit cannot show as available in several places at once. This matters because Amazon expects a cancellation rate under 2.5% and Walmart under 2%, and breaching those thresholds can suspend your listings.
EDI 846 reports what stock is available right now, sent to tell a partner what they can order. EDI 852 reports what has actually moved, including units sold, on hand, and returned by store and period. The 846 supports ordering decisions; the 852 supports forecasting and replenishment planning.
No. EDI is the transport layer that delivers demand data; forecasting software is what models it. What EDI changes is the input quality. A forecasting engine fed store-level EDI 852 sell-through and EDI 830 planning schedules produces better output than the same engine fed only your own historical shipments.
EDI reduces the safety stock you need in two ways. It shortens and stabilizes lead times, which shrinks the variability the buffer has to absorb. It also creates a dated transaction history of every order and receipt, which lets you calculate the buffer statistically rather than estimating it from memory.
It depends on whether your trading partners require it, and most large retailers do. For lower volumes, a cloud or web-based EDI service avoids the cost of integration and dedicated staff while still meeting partner compliance requirements. The break-even usually arrives sooner than expected once chargebacks and manual rekeying are counted.
A single trading partner on a cloud service can be live in days to a few weeks. A full ERP-integrated deployment across multiple partners typically runs several weeks to a few months, depending on how many document types are required and how clean your item master is. Data quality is usually the long pole, not the EDI itself.
A reorder point is the stock level that triggers replenishment. The standard calculation is average daily demand multiplied by lead time in days, plus safety stock. With demand of 60 units a day, a 5-day lead time, and 200 units of safety stock, the reorder point is 500 units. Recalculate it as lead times and demand change.
Phantom inventory. The record says the unit exists and the shelf or bin does not have it, usually because of shrink, misplacement, receiving errors, or an unrecorded damage write-off. EDI improves the accuracy of data moving between organizations; correcting the record against physical reality requires cycle counting, with the EDI 947 used to transmit the adjustment.
Yes, and the overstock side is often the larger recovery. Overstock costs about $572 billion globally each year against $1.2 trillion for out-of-stocks, but overstock capital is recoverable while a lost sale is not. Better demand data and shorter lead times let you hold less cover for the same service level.