Top 30 Supply Chain KPIs Your Business Should Be Tracking & Measuring
The Complete Guide to Supply Chain KPIs

Introduction to Supply Chain KPIs
Supply chains are complex systems that link suppliers, manufacturers, retailers, and consumers. They help deliver products on time and in the right quantities at the lowest possible cost. In today’s competitive business environment, supply chains must be efficient and effective. To do so, they must have visibility across their entire value chain.
A good supply chain metric system helps companies understand how well their supply chain is performing by measuring key performance indicators (KPIs) such as inventory levels, order fulfillment times, shipping costs, and customer service at each stage in the process.
These KPIs are critical for companies because they help them track the progress of an organization’s supply chain, provide a snapshot of the current state of the supply chain and allow managers to identify areas where improvement is needed and make informed decisions about their businesses.
To identify the right KPIs for your company, start by asking yourself what you need to know about your business. What do you need to track? How often should you check these numbers? Once you have identified the KPIs you need to track, you can use a KPI dashboard to keep an eye on them.
Building a good KPI dashboard is the key that will provide you with a clear picture of where your business stands at any given moment. To build such a KPI dashboard you must have access to accurate data. This includes data about your customers, suppliers, products, employees, finances, and other key aspects of your business. Without these numbers, you will not be able to effectively perform business operations.
Once you build the KPI dashboard It will allow you to see trends and patterns so you can make informed decisions. You can use data analytics tools to measure KPIs such as inventory levels, customer satisfaction, and sales performance. These tools can help you understand how well your business is performing and whether there are areas that need improvement.
Download the Free Supply Chain KPIs Guide
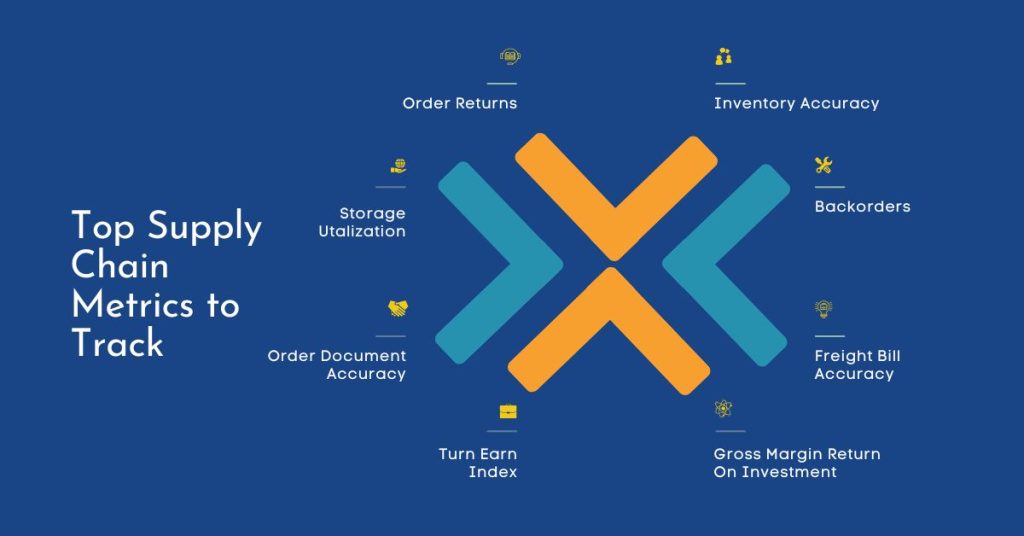
Here is the list of 30 supply chain KPIs & metrics that will help you measure the performance of your supply chain
- Inventory Turnover Rate (ITR)
- Perfect Order Measurement (POM)
- Fill Rate (FR)
- Customer Order Cycle Time (COCT)
- Inventory Accuracy (IA)
- Backorder (BO)
- Freight Cost Per Unit (FCU)
- Freight Bill Accuracy
- Cash to Cash Cycle Time (CCCT)
- Supply Chain Cycle Time (SCCT)
- On-Time Delivery (OTD)
- In Full Delivery (IFD)
- Pick and Pack Cycle Time (PPCT)
- Gross Margin Return on Investment (GMROI)
- Total Supply Chain Cost as a Percentage of Sales
- Inventory Days of Supply (IDS)
- Day Sales of Inventory (DSI)
- Inventory Velocity (IV)
- Inventory to Sales Ratio (ISR)
- Damage Free Delivery (DFD)
- Turn-earn index (TEI)
- Order Return Rate (ORR)
- Average Payment Period for Production Materials
- Order Document Accuracy (ODA)
- Storage Utilization in the Warehouse
- Inventory Adjustments Made
- Carrying Cost of Inventory
- Tracking Adjustments to Cycle Counts
- Skips and Alternate Picks
- Use of Packing Material
Define Supply Chain KPIs
Supply chain KPIs are measurements used to assess the performance of a supply chain. These KPIs can help businesses evaluate the efficiency and effectiveness of their supply chain operations, identify areas for improvement, and make data-driven decisions to optimize their supply chain. Examples of supply chain KPIs include on-time delivery, inventory turnover, and order fulfillment rate. These metrics can be used to track the performance of individual parts of the supply chain, such as the production process or the transportation of goods, as well as the overall performance of the supply chain as a whole. By regularly tracking and analyzing supply chain KPIs, businesses can improve their supply chain operations and better serve their customers.
- Inventory Turnover Rate (ITR)
ITR measures how quickly inventory turns over in a company’s warehouse. It is calculated by dividing the total cost of goods sold by the average day’s inventory held at the end of the period. A high ITR indicates that there is more turnover than expected, while a low ITR means that inventory is being stored longer than necessary.
Formula to calculate Inventory Turnover Rate (ITR):
Inventory turnover ratio = cost of goods sold in period / [(opening stock in period-closing stock in period)/2]
- Perfect Order Measurement (POM)
Perfect order measurement measures the percentage of orders that are error-free. This measurement can be broken down into various stages including procurement, production, transportation, and warehousing.
Formula to calculate Perfect Order Measurement (POM)
((total orders -error orders)/total orders) *100
- Fill Rate (FR)
Fill rate is important to customer satisfaction and has implications for transportation efficiency. The fill rate is calculated as the percentage of a customer’s order that is filled on the first shipment. This includes no items, SKUs, or order value that is included with the first shipment.
Formula to calculate fill rate (FL)
(1-((total items – shipped items)/total items)) *100
- Customer Order Cycle Time (COCT)
Customer order cycle time is measured by the difference between the number of days between the business receiving the order and the moment the order is delivered to the customer.
This metric also helps businesses understand how fast they are delivering the order to customers, which can in turn improve customer satisfaction and measure the efficiency of the supply chain.
Formula to calculate Customer Order Cycle Time COCT)
Customer order cycle time = (Actual delivery date – purchase order creation date)
- Inventory Accuracy (IA)
It is important for businesses to have an accurate measurement of the inventory of all the products sold. This could reduce inventory storage costs and stock outages. Inventory accuracy is calculated by comparing the physical inventory with what is recorded in your database.
Formula to calculate Inventory Accuracy
Inventory Accuracy = Database inventory count / Physical inventory count
- Backorder (BO)
Backorders are orders that cannot be fulfilled at the time a customer places them. These orders are received in advance before the business even has an inventory to fulfill them. These are usually done by businesses when they are launching a new product or when the product in high demand is out of stock and the business is aware of the next shipment for a product with a tentative time and date it will be available and would encourage their customers to place orders in advance.
Consistent large backorders are an indication that something is wrong with the supply chain and It can be reduced by using inventory management with real-time data on your stock levels and reordering product before they go out of stock.
Formula to calculate Backorders
Backorder = (Number of undelivered orders/total number of orders received) *100
- Freight Cost Per Unit (FCU)
This metric is used to measure the shipping cost per unit. Reviewing this metric can allow businesses to reduce/optimize shipping costs and negotiate freight company contracts.
Formula to calculate Freight Cost Per Unit
Freight cost per unit = (overall freight cost/number of units shipped)
- Freight Bill Accuracy
This metric measures the percentage of freight bills that are error-free
Formula to calculate Freight Bill Accuracy
Freight Bill Accuracy = (error-free freight bills/total freight bills) *100
- Cash to Cash Cycle Time (CCCT)
This metric measures the length of time between when you pay suppliers for materials and when customers pay for the finished product. This metric will help businesses to identify potential causes of cash flow issues. You want this cash-to-cash cycle time to be as short as possible.
Formula to calculate Cash to Cash Cycle Time
Cash to Cash Cycle Time = (receivable days + Inventory days) – (payable days)
- Supply Chain Cycle Time (SCCT)
Supply chain cycle time measures how long it would take to complete an order if inventory levels are zero. This metric provides an overview of the efficiency of your entire supply chain.
Formula to calculate Supply Chain Cycle Time
Supply Chain Cycle Time = time it takes to order and receive supplies + order fulfillment cycle time
- On-Time Delivery (OTD)
As it says, this metric is used to measure the percentage of orders delivered as scheduled without any delays.
Formula to calculate On-Time Delivery
On-Time Delivery = [(total orders – orders that do not arrive on time)/total orders] *100
- In Full Delivery (IFD)
This metric measures the percentage of sales orders that are delivered completely in the first shipment.
Formula to calculate In-Full Delivery
In Full Delivery = [(total orders – orders that are not complete or are incorrect in first shipment)/total orders] *100
- Pick and Pack Cycle Time (PPCT)
This metric measures the time it takes to source and packages all products for shipment. Analyzing this metric can help improve your warehouse storage and order fulfillment processes.
Formula to calculate Pick and Pack Cycle Time (PPCT)
Pick and pack cycle time = (time of order completion – start time for order fulfillment)
- Gross Margin Return on Investment (GMROI)
This metric measures how much money a company makes on a specific inventory investment. Tracking this metric gives your company insights into which product inventory is performing poorly and which ones are good performers.
Formula to calculate the Gross margin return on investment (GMROI)
Gross margin return on investment (GMROI) = Gross profit / [(opening inventory in the period – closing inventory in the period) /2] *100
- Total Supply Chain Cost as a Percentage of Sales
This metric measures the total cost of your supply chain operations compared with your overall sales
Formula to calculate total supply chain cost as a percentage of sales
Total supply chain cost as a percentage of sales = (total supply chain costs / total sales) *100
- Inventory Days of Supply (IDS)
This metric measures the number of days it takes for a company to run out of inventory if it doesn’t add to its supply. This metric helps businesses to make sure that they don’t keep too much inventory on hand, which ties up the cash and makes sure that it has enough inventory to satisfy customer demands. This is sometimes also called par level.
Formula to calculate Inventory Days of Supply (IDS):
Inventory days of supply (IDS) = (avg inventory in a month, in dollars / monthly product demand, in dollars) *30
- Day Sales of Inventory (DSI)
DSI metric measures the number of days the inventory remains in stock over a certain period. It’s a measurement of how long it takes for a company to sell the items it buys or makes.
Formula to calculate Day Sales of Inventory (DSI)
Day sales of inventory = (ending inventory/cost of goods sold) * number of days in the period
- Inventory Velocity (IV)
This metric helps measure how companies can efficiently manage their inventory. This helps companies meet customer demands and improve inventory turnover rates.
Formula to calculate Inventory velocity
Inventory velocity (IV) = (opening inventory for a period/sales forecast) *100
- Inventory to Sales Ratio (ISR)
This metric helps companies optimize their inventory and stocking levels to align with sales expectations. Helps companies prepare for unexpected situations, improve inventory turnover rates and change existing sales or inventory strategies.
Formula to calculate Inventory to sales ratio (ISR)
Inventory to sales ratio (ISR) = (Inventory for sales / net sales)
- Damage Free Delivery (DFD)
Damage-free delivery helps companies analyze the number of damaged deliveries that customers reported. This can help companies to make decisions regarding shipping procedures and decide if they want to use a particular logistics company.
Formula to calculate Damage free delivery (DFD)
Damage free delivery (DFD) = [(total orders – orders that arrive damaged)/total orders] *100
- Turn-earn index (TEI)
This metric evaluates the company’s profits and its effective use of inventory. This metric helps a company balance its inventory turnover ratio with its profits, which can optimize customer experience while enabling the company to remain profitable.
Formula to calculate Turn-earn index (TEI)
Turn-earn index (TEI) = (inventory turnover ratio x gross profit percentage) *100
- Order Return Rate (ORR)
This metric measures the rate at which the orders are returned to you. This metric will help you identify why customers are returning their orders and spot weakness in your supply chain and make necessary improvements.
Formula to calculate Order return rate (ORR)
Order return rate = (Total items Returned / Total Items Shipped)
- Average Payment Period for Production Materials
This metric calculates the average time from receipt of materials and payment for those materials
Formula to calculate Average payment period for production materials,
Average payment period for production materials = (Materials Payables / Total cost of Materials) *Days in Period
- Order Document Accuracy (ODA)
This metric measures the percentage of orders in which all documents relating to the order are accurate
Formula to calculate Order Document Accuracy
Order document accuracy = [(total orders – orders without accurate documentation) / total orders] *100
- Storage Utilization in the Warehouse
This metric measures the number of square feet occupied with a product vs the total square feet of storage capacity. Some companies measure in cubic feet which include high-density frozen goods warehouses.
Calculating the number of locations used vs the total number of storage locations is also very useful, especially when broken down by storage location type/size
Formula to calculate the Storage utilization in the warehouse
Storage utilization in the warehouse = (Total square feet of storage capacity – square feet occupied by the products)
- Inventory Adjustments Made
This can be compared to credits issued to customers to provide a more complete picture
- Carrying Cost of Inventory
This metric measures the costs associated with having the product in the warehouse. The longer the product is in the warehouse the higher the costs.
- Tracking Adjustments to Cycle Counts
How many adjustments are being made, and what magnitude are they?
How many are initiated via a primary counter versus a secondary counter performing recounts?
- Skips and Alternate Picks
How often a picker skips the originally scheduled pick task/assignment and how often an alternate (location or item) is picked
- Use of Packing Material
Tracking this metric will help Understand how much packing material your company uses and reduce excess packing waste and optimize packing material expenses. Also, improves order fulfillment process by streamlining pick and pack processes.
Conclusion
Tracking all these supply chain KPIs can be a difficult task. Businesses should invest in a business analytics solution that can connect to all different data sources and provide data on all/some of these KPIs/metrics that are relevant to your bottom line.
It’s important that these supply chain KPIs/metrics are communicated to those who will be impacted by them as soon as possible. Results need to be communicated swiftly, accurately, and concisely to have the most influence on the people who create the input for them. Delays in communicating these metrics will lose impact on the associates on the floor.
If you don’t have the time or resources to track and analyze your supply chain KPIs/metrics. Commport communications has the tools and expertise you need to monitor your supply chain KPIs and help improve and stremline your supply chain operations. Contact our team today!
Ready to find out more about Commport Business Analytics Solution?
Drop us a line today for a free quote!