
")

Introduction
Inventory distortion costs businesses worldwide a staggering $1.77 trillion per year. Demand forecasting in supply chain management remains one of the most challenging yet crucial processes for companies struggling to balance inventory levels.
Getting your inventory balance wrong creates serious problems on both sides. Too much inventory leads to discounts and storage costs, while too little inventory sends customers looking elsewhere. Furthermore, companies relying solely on historical data often experience forecast error rates exceeding 50% in fast-moving product categories.
We’ve identified eight proven approaches to fix these persistent challenges. From data accuracy improvements to managing supply chain variability, these solutions address the core issues that make forecasting so difficult. In fact, businesses implementing advanced forecasting systems have reduced excess inventory by up to 30% while improving fill rates. With the demand forecasting software market projected to reach $7.9 billion by 2029, now is the time to upgrade your approach and gain a competitive advantage.
- Fix Data Accuracy Issues
- Resolve Data Availability Gaps
- Integrate Fragmented Data Systems
- Manage Supply Chain Variability
- Prepare for Demand Disruptions
- Account for External Market Volatility
- Break Down Communication Silos
- Simplify Forecasting Complexity
Key Takeaways
- Fix data accuracy first– Clean, complete, and timely data forms the foundation of reliable forecasting, with accurate data reducing forecast errors by 20-50%
- Bridge data gaps with external sources– Use proxy data, weather patterns, economic indicators, and IoT sensors when historical data is insufficient
- Integrate fragmented systems– EDI and GDSN solutions unify scattered data across departments, enabling real-time visibility and standardized information exchange
- Build strategic buffers for variability– Implement stock, time, and capacity buffers with color-coded monitoring to absorb natural supply chain fluctuations
- Prepare for disruptions with scenario planning– Create upper, lower, and “most likely” forecasts while using historical comparisons to quickly assess impact
- Break down communication silos– Implement Sales & Operations Planning (S&OP) processes to align departments and create shared forecasting accountability
1. Fix Data Accuracy Issues
The foundation of successful demand forecasting in supply chain management rests on one critical element: data accuracy. Without reliable data, even the most sophisticated forecasting models will falter, leading to costly inventory distortions and operational inefficiencies
What is Data Accuracy in Demand Forecasting
Data accuracy in demand forecasting refers to the completeness, correctness, and timeliness of information used to predict future demand patterns. Accurate data contains no gaps, duplicates, or outdated figures and remains consistent across all systems. Essentially, it’s about ensuring the inputs to your forecasting models reflect real-world conditions as closely as possible.
According to supply chain experts, the principle is simple yet profound: “garbage in, garbage out.” if your data is flawed, your forecast will be equally unreliable. This principle becomes particularly important when examining forecast accuracy metrics (FAMs) such as Bias/ME, MAE, MAPE, and RMSE, each measuring different aspects of prediction performance.
Data accuracy encompasses several key dimensions:
- Completeness: All relevant demand signals are captured
- Consistency: Data maintains uniformity across systems
- Timeliness: Information is current and reflects recent market conditions
- Validity: Data conforms to predefined rules and business requirements
Why Data Accuracy Matters in Supply Chain Planning
Poor data quality creates cascading problems throughout the supply chain. When forecasts miss their mark due to inaccurate data, companies face serious consequences, including misallocation of resources, cash flow problems, and diminished stakeholder confidence.
The financial impact is substantial—companies using data-driven forecasting methods see a 20-50% reduction in forecast errors, directly improving profitability. Additionally, accurate data enables businesses to optimize inventory management, preventing both costly stockouts and excess inventory holding costs.
Beyond financial benefits, accurate data serves several critical functions:
First, it enables precise safety stock calculations. As noted by inventory specialists, “The less accurate the forecast, the more safety stock you’ll need”. This relationship directly affects capital efficiency and warehouse costs.
Second, accurate data powers effective demand planning. Quality data on historical sales, market trends, and seasonal patterns allows manufacturers to forecast demand with greater precision, preventing overproduction or underproduction.
Lastly, reliable data facilitates agile decision-making. Real-time, accurate information enables businesses to adapt quickly to changing conditions rather than relying on outdated reports.
How to Improve Data Accuracy Using Audits and Validation Tools
Improving data accuracy requires systematic approaches and appropriate tools. Regular data audits serve as the foundation for these periodic reviews, which identify quality issues and ensure data meets established standards. Through audits, companies can spot inconsistencies, gaps, and outdated information that would otherwise compromise forecasting.
Data validation tools provide another essential solution. These technologies check data for accuracy, completeness, and conformity to predefined rules through techniques like:
- Input validation: Screening data as it enters systems
- Range checks: Ensuring values fall within expected parameters
- Data type checks: Verifying information is formatted correctly
For comprehensive improvement, implement these proven strategies:
- Data cleansing: Identify and remove incorrect, incomplete, or irrelevant data through deduplication, standardization, and transformation procedures.
- Data standardization: Ensure consistency by establishing naming conventions and uniform data formats across all systems.
- Data governance: Create clear roles and responsibilities, define quality metrics, and regularly monitor performance. Strong governance provides the framework for sustainable accuracy.
- Advanced analytics: Deploy business intelligence (BI) tools that analyze data and generate actionable insights through visualization. These tools allow assessment of multiple performance indicators simultaneously and can identify specific products needing attention.
- Employee training: Cultivate a culture of data quality awareness through ongoing training and guidance.
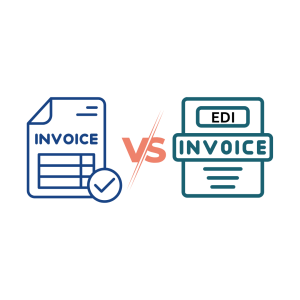
Modern technologies like EDI (Electronic Data Interchange) and GDSN (Global Data Synchronization Network) solutions help unify fragmented data systems, thereby enhancing demand forecasting accuracy. These technologies facilitate seamless information sharing between trading partners, ensuring consistent, standardized data flows throughout the supply chain.
Remember that improving data accuracy is not a one-time effort but an ongoing process requiring regular assessment, metric tracking, and analytics to identify areas for continuous optimization.
2. Resolve Data Availability Gaps
Even with the most pristine data quality, many supply chain professionals face a more fundamental challenge—not having enough data to work with in the first place. This data availability gap remains a significant barrier to accurate demand forecasting in supply chain management.
What is Data Availability in Demand Forecasting
Data availability refers to the completeness, accessibility, and adequacy of information needed to build reliable forecasting models. Despite advances in data collection, many organizations struggle with incomplete datasets, especially for new products, emerging markets, or during anomalous periods like sales events or disruptions.
Moreover, data availability challenges manifest in several ways:
- Historical data gaps for new or seasonal products
- Limited peak-period information for predictive modeling
- Inconsistent data collection across organizational silos
- Insufficient external context that shapes demand patterns
As forecasting technology becomes more sophisticated, the need for comprehensive data grows correspondingly. Nevertheless, companies must often work with the information they have, even when it’s insufficient for traditional forecasting methods.
Why Limited Data Affects Forecasting Accuracy
Insufficient data significantly undermines forecasting effectiveness. Indeed, studies show that forecasting models relying on limited datasets produce predictions with approximately 10% higher error rates. Consequently, this reduced accuracy ripples throughout the supply chain, affecting inventory levels, production scheduling, and customer satisfaction.
Prior to making predictions, companies must understand how limited data distorts forecasts. One-off events can significantly skew future projections when not properly contextualized. For instance, a sales spike following media coverage might create misleading patterns if incorporated into standard forecasting algorithms.
Beyond that, limited internal data means companies miss critical external factors that drive demand fluctuations. Despite knowing this, a striking 99% of CFOs surveyed need real-time data to make better decisions, yet merely 16% have such data available. This gap between recognition and implementation represents a major challenge for supply chain forecasting.
How to Use Proxy Data and External Indicators
To overcome data limitations, forward-thinking companies now leverage innovative approaches involving proxy data and external indicators. Proxy data refers to information from non-peak periods or similar products that can substitute for missing data in forecasting models. This technique proves especially valuable when historical information for specific scenarios is scarce.
In addition to proxy data, incorporating external indicators substantially improves forecast accuracy:
- Economic indicators – Monitor inflation rates, consumer sentiment, interest rates, and housing starts to anticipate demand shifts
- Market trends – Track competitor movements, industry benchmarks, and market growth rates
- Weather patterns – Use climate data to predict seasonal demand fluctuations
- Web analytics – Analyze online behavior and search trends as early demand signals
Companies can access these external data sources through APIs (Application Programming Interfaces), creating a more comprehensive view of market conditions. For instance, utility companies have successfully used weather APIs to forecast maintenance demand at specific locations.
To implement these approaches effectively:
First, identify the critical data elements most relevant to your forecasting needs, such as supplier information, order quantities, pricing, and promotion dates.
Second, establish a data governance framework that documents sources, locations, and security protocols for all information used in forecasting.
Third, create a standardized preparation process that screens for anomalies and ensures consistent formatting.
Finally, consider using Internet of Things (IoT) sensors for real-time data collection—an approach projected to grow by 24.9% in 2027.
Through these strategies, companies can transform data limitations from forecasting barriers into manageable challenges, ultimately creating more resilient and responsive supply chains.
3. Integrate Fragmented Data Systems
Supply chain fragmentation costs organizations billions annually through delays, missed opportunities, and excess inventory. When critical data becomes trapped in departmental silos, demand forecasting accuracy plummets, and supply chain resilience suffers.
What is Data Fragmentation in Supply Chain Forecasting
Data fragmentation occurs when an organization’s information becomes scattered across different systems, applications, and storage locations. Although this data might function correctly for individual tasks, its dispersed nature makes it difficult to analyze and integrate effectively for forecasting purposes.
Two primary types of fragmentation affect supply chain operations:
- Physical fragmentation: Data scattered across different physical locations or storage devices, making integration technically challenging and time-consuming
- Logical fragmentation: Data segments duplicated or divided across different applications, creating inconsistent versions of the same information
These problems frequently stem from decentralized data storage, inconsistent naming conventions, and reactive approaches to immediate needs rather than building sustainable data architecture.
Why Fragmented Systems Hinder Demand Planning
In fragmented supply chains, suppliers, manufacturers, logistics firms, and distributors operate in isolation rather than as integrated systems. This siloed approach creates numerous forecasting challenges:
First, it eliminates end-to-end visibility. Without a unified view of supply chain processes, businesses struggle to identify inefficiencies or optimization opportunities.
Second, fragmentation severely impacts risk management. When you lack clear visibility across each supply chain link, building resilience and responding to disruptions becomes exponentially more difficult.
Third, fragmentation drives up costs through process inefficiencies. When suppliers and manufacturers don’t communicate effectively, it leads to overproduction or underproduction, causing excess inventory or stockouts respectively.
Perhaps most concerning, fragmentation directly damages demand signal visibility. As each contractor or supplier only receives pieces of information relevant to their specific part, the ability to see true end-to-end demand dissolves. This creates systemic delays in visibility of both urgent needs and long-term requirements.
How EDI and GDSN Solutions Help Unify Data
Addressing fragmentation requires specialized technologies that can bridge communication gaps between trading partners. Two critical solutions stand out:
Electronic Data Interchange (EDI) enables standardized electronic document exchange between businesses, replacing traditional paper-based systems. For demand forecasting specifically, EDI creates direct connections between trading partners, allowing real-time visibility of orders, inventory, and shipments—essential components for accurate forecasting.
Global Data Synchronization Network (GDSN) serves as the cornerstone of global supply chain efficiency. This technology enables companies worldwide to exchange standardized product data with trading partners, ensuring accuracy and consistency across all channels.
GDSN offers several specific benefits for demand forecasting:
First, it establishes a common language between retailers and distributors. Every product receives an identifier housing all relevant data including category, size, weight, and shipping logistics, creating standardized data that forecasting algorithms can process consistently.
Second, GDSN synchronizes data in real-time, allowing suppliers to update product information immediately for all trading partners. This real-time capability streamlines operations from start to finish, significantly reducing errors throughout the forecasting process.
Third, it provides operational transparency with full end-to-end visibility of inventory and activities. Managers can observe supply chain movements as they happen, allowing better service and faster adjustments to inventory management based on actual demand patterns.
Ultimately, these technologies enable companies to adapt quickly to sudden changes, efficiently balancing supply and demand to avoid costly oversupply or undersupply situations.
4. Manage Supply Chain Variability
Natural fluctuations in supply chains cost businesses millions annually through excess inventory and stockouts. Unlike data quality issues, variability remains an inevitable element of supply chain operations that must be managed rather than eliminated.
What is Supply Chain Variability?
Supply chain variability refers to the fluctuations in demand and supply that disrupt the flow of goods and services throughout a supply chain network. These variations originate from unpredictable customer demand, production delays, or changes in lead times, directly impacting inventory management strategies.
Three major types of variability affect supply chains:
- Demand variability: Unpredictable customer purchasing patterns
- Supply variability: Fluctuations in material availability and delivery
- Operational variability: Production inconsistencies and equipment failures
As one logistics expert explains, “Variability is always present as a natural part of any process and describes the random disruptions that may occur as a process or event is undertaken”. Hence, even the most sophisticated forecasting systems must account for these natural fluctuations.
Why it Disrupts Demand and Forecasting
Variability creates a perfect storm for demand forecasting efforts. Initially, it leads to either excess inventory or stockouts, both negatively affecting customer satisfaction and operational efficiency. Subsequently, these fluctuations trigger what supply chain analysts call the “bullwhip effect”—where small changes in customer demand cause progressively larger fluctuations upstream in the supply chain.
The impact becomes compounded since “higher variability in demand means businesses must increase their safety stock to prevent stockouts”. Obviously, this creates a vicious cycle: more variability leads to higher inventory buffers, which in turn increases carrying costs.
Weather changes, competitor promotions, and seasonal trends all contribute to demand fluctuations that traditional forecasting methods struggle to accommodate. Since these factors change constantly, companies making manual adjustments often achieve mixed results at best.
How to Build Buffers and Use Risk Monitoring Tools
To manage variability effectively, forward-thinking companies implement strategic buffers—safeguards that absorb fluctuations without disrupting overall operations. Supply chain experts recommend three types of buffers working in concert:
- Stock buffers: Strategic inventory positioned at key points in the supply chain
- Time buffers: Planned schedule cushions that allow for unexpected delays
- Capacity buffers: Reserved production and logistics capabilities for demand spikes
These buffers should be visualized using color-coded systems (red/yellow/green) that allow teams to quickly understand priorities and make decisions that promote fast, reliable flow.
Beyond buffers, effective risk monitoring tools have become essential. Supply chain risk management software (SCRM) identifies, assesses, and mitigates risks, helping companies stay competitive and resilient. These platforms provide critical capabilities including supply chain mapping, real-time alerts, and risk intelligence.
For optimal performance, businesses should implement buffer management analytics that track daily buffer status. This approach enables continuous improvement by adjusting buffer sizes based on actual performance data. Through this strategy, companies can enhance flow speed and reliability while reducing overall inventory investment.
5. Prepare for Demand Disruptions
Sudden market shifts and unexpected events regularly disrupt even the most carefully planned supply chains, creating a need for resilient demand forecasting methods. Throughout 2023-2024, companies witnessed how quickly market conditions can change, requiring new approaches to anticipate demand variations.
What are Demand Disruptions in Logistics
Demand disruptions are unexpected events that cause significant spikes or drops in product demand, breaking existing patterns in your supply chain. These disruptions come in various forms:
- Viral social media trends causing sudden popularity
- Product safety recalls necessitating rapid response
- Weather events affecting regional purchasing patterns
- Promotional activities creating short-term demand surges
- Transportation breakdowns disrupting normal flow
As one logistics expert explained, “The overnight changes in demand can throw off your forecasts, leading to backups and out-of-stock challenges”. Certainly, these disruptions differ from normal variability because they often occur without warning and require immediate action rather than gradual adjustment.
Why Sudden Changes Impact Inventory Demand Forecasting
Sudden demand shifts present unique forecasting challenges primarily because they break historical patterns upon which most models rely. When viral trends or safety recalls occur, past data becomes temporarily irrelevant for predicting immediate future needs.
Consider the example of companies sourcing from 24 countries globally who “had to realign significant portions of supply chain” due to geopolitical disruptions. These adjustments affected ocean carrier selection, vessel schedules, transit times, and inland transport needs—all critical components of accurate forecasting.
For inventory management, the consequences are substantial. Without preparation, companies face either costly stockouts during demand spikes or excess inventory during sudden drops, both leading to thinner margins and dissatisfied customers.
How to Use Scenario Planning and Historical Comparisons
Effective companies tackle disruption through two complementary approaches:
First, implement scenario planning with upper, lower, and “most likely” thresholds instead of rigid forecasts. This approach provides flexibility to plan for different outcomes. As one expert noted, “A robust forecasting program should help you answer stakeholder questions like how much demand will return and when”.
Second, utilize historical comparisons by creating a process where planners quickly determine a disruption’s impact by comparing it to similar past events. For instance, “if a product safety issue hits the news, planners can reference past incidents that show demand typically dropped by a specific percentage for a set amount of time—say, by 25% for two weeks”.
Advanced demand sensing tools using AI and machine learning can further strengthen these strategies by analyzing data patterns and offering insights that help forecast unusual demand shifts before they fully materialize.
6. Account for External Market Volatility
External factors beyond your control frequently undermine even the most sophisticated demand for forecasting models. Understanding market volatility and implementing appropriate tools remains critical for maintaining supply chain resilience amid changing conditions.
What is external volatility in demand forecasting
External volatility in demand forecasting refers to the unpredictable changes in demand patterns caused by factors outside your organization’s direct control. These include macroeconomic conditions, geopolitical events, technological advancements, competitors’ actions, and evolving consumer preferences.
Unlike internal variability, external volatility creates prolonged uncertainty that doesn’t necessarily disrupt forecasts overnight but gradually reshapes demand patterns. Consider how technological shifts like AI adoption steadily influence market dynamics or how regulatory policy changes impact entire industries.
External volatility manifests through several key indicators:
- Market shifts and global events
- Regulatory policy changes
- Consumer attitude fluctuations
- Availability of product alternatives
Notably, the coefficient of variation (CoV) serves as an effective metric for measuring volatility in demand forecasting. As a scale-independent measurement representing uncertainties in data, CoV helps identify which demand series require special forecasting approaches.
Why external factors affect forecasting in supply chain management
External volatility creates unique challenges primarily because traditional forecasting models struggle to incorporate variables outside historical data patterns. Various elements such as promotion, weather, market trends, and seasonality significantly impact consumer behavior, contributing to demand uncertainty.
As revealed in industry research, demand series with large CoV values contain greater uncertainties and prove exceptionally difficult to forecast accurately. Without accounting for these external factors, companies experience excess costs related to stockouts, inventory holding, and capacity utilization.
Primarily, external volatility complicates forecasting through:
- Distorting historical patterns that algorithms rely on
- Creating unpredictable consumer behavior shifts
- Introducing complexity that simple models cannot capture
How to use dashboards and rolling forecasts
To effectively manage external volatility, implement dashboards that track external indicators influencing product demand. These visualization tools should monitor unemployment rates, GDP growth, and commodity prices that correlate with your specific product demands.
Likewise, rolling forecasts provide a powerful complement to dashboards. Unlike traditional static forecasts, rolling forecasts continuously update as new information becomes available, allowing for regular adjustment to changing conditions.
For optimal results, create multiple forecast scenarios—baseline, optimistic, and pessimistic—to prepare for different potential outcomes. This approach ensures plans exist regardless of which direction external factors shift.
Additionally, machine-backed forecasting engines can evaluate how growth trends, seasonality, and special events impact specific products. These systems analyze how demand grows over time, whether growth follows linear or logistic patterns, and how seasonal factors affect purchasing behavior.
By combining these approaches, companies transform planning from reactive guesswork into disciplined, insight-driven action even amid external volatility—ultimately protecting margins, service levels, and overall supply chain performance.
7. Break Down Communication Silos
Departmental isolation creates one of the most insidious barriers to effective demand forecasting. When teams operate independently without sharing critical information, even the best forecasting tools and data systems fail to deliver accurate results.
What are Communication Silos in Forecasting
Communication silos in forecasting occur when departments, teams, or systems operate in isolation with limited collaboration or visibility into what other supply chain members are doing. These barriers emerge when departments hoard information due to competitiveness or lack of trust, with outdated communication methods contributing to misunderstandings and delays.
In siloed organizations, departmental priorities typically supplant company-wide goals, leading to impaired communication between suppliers and business units. Therefore, when purchasing teams lack visibility into broader supplier relationships, they miss opportunities for coordinated forecasting that could prevent stockouts or excess inventory.
Why Cross-Functional Collaboration is Essential
Cross-functional collaboration forms the backbone of accurate demand forecasting. Companies implementing Sales and Operations Planning (S&OP) processes see significant improvements because S&OP acts as a key communication tool to keep supply chain organizations ahead of potential bottlenecks.
Effective collaboration delivers multiple benefits:
- Creates synchronized efforts toward company-wide goals rather than departmental targets
- Enables better analysis of forecasted numbers based on actual demand
- Allows for adjustments based on input from various departments with different perspectives
As a matter of fact, without cross-departmental collaboration, manufacturers might produce products without input from sales and marketing teams, creating no correlation between production volume and actual market needs.
How to Implement S&OP and Shared Forecast Logs
To implement effective S&OP processes, begin with securing support from senior management and key stakeholders across sales, operations, finance, logistics, and purchasing. Thereafter, align the S&OP process with finance by using the same dispatch/sales information as input for both forecasts.
Establishing clear governance with defined roles creates understanding and accountability between departments. Alongside this, leverage integrated technology that offers seamless integration between existing ERP and CRM systems.
Creating a shared forecasting language helps avoid misunderstandings by standardizing metrics and terminology across departments. Until now, many companies have struggled with divergent objectives between business units, yet consistent training helps reduce pushback from staff members.
Electronic Data Interchange (EDI) and Global Data Synchronization Network (GDSN) solutions strengthen these collaborative processes by enabling standardized information exchange between trading partners, creating the transparency needed for accurate collaborative forecasting.
8.Simplify Forecasting Complexity
As businesses expand their product portfolios, forecasting complexity emerges as a persistent challenge undermining inventory management accuracy. Managing this complexity effectively requires strategic simplification through segmentation and automation.
What is Forecast Complexity in Inventory Management
Forecast complexity refers to the increasing difficulty in predicting demand patterns as product variety, customer segments, and distribution channels multiply. This complexity manifests when traditional forecasting methods struggle to handle diverse product behaviors within a single framework. Currently, many companies employ separate forecasting techniques for different product categories, creating additional layers of complexity.
Why Complexity Increases with Business Growth
Business growth naturally drives forecasting complexity through several mechanisms. As companies expand, they typically face:
- Diversified product offerings requiring different suppliers, materials, and components
- Varied manufacturing processes and equipment needs
- Multiple transportation modes and distribution channels
- Different product lifecycle stages requiring tailored strategies
At this point, forecasting becomes progressively challenging because “most companies will use human judgments (which are often biased) or arbitrary rules to create segments”.
How to Segment Products and Automate Low-Risk Forecasts
To simplify forecasting complexity, implement these proven approaches:
First, develop strategic product segmentation based on characteristics like demand volume, variability, strategic importance, and profitability. Historical sales data can be analyzed using statistical techniques and k-means clustering algorithms to identify distinct segments.
Second, automate forecasting processes by allowing AI solutions to select appropriate methods for different product segments. As well as improving accuracy, automation eliminates manual adjustments that often introduce bias.
Finally, prioritize human oversight for high-value or highly volatile products while allowing automated systems to handle low-risk forecasts, creating a balanced approach that maximizes efficiency without sacrificing accuracy.
Conclusion
Demand forecasting challenges remain a critical issue for supply chains worldwide, with inventory distortion alone costing businesses a staggering $1.77 trillion annually. Throughout this article, we explored eight proven approaches that directly address these persistent challenges. Data accuracy stands as the foundation, while addressing availability gaps through proxy data and external indicators builds reliability. Certainly, integrating fragmented systems creates the unified view essential for accurate predictions.
Beyond that, effective management of supply chain variability through strategic buffers allows businesses to absorb fluctuations without disrupting operations. Preparing for demand disruptions with scenario planning and addressing external market volatility through rolling forecasts further strengthens forecasting resilience. Breaking down communication silos and simplifying forecasting complexity round out the comprehensive approach needed for success.
EDI and GDSN solutions play a crucial role in transforming demand forecasting efforts. These technologies bridge communication gaps between trading partners, standardize product data exchange, and enable real-time visibility across the supply chain. Their implementation creates consistency in data flows—the very foundation upon which accurate forecasting depends.
Ultimately, successful demand forecasting requires a balanced approach combining technology, process improvements, and strategic planning. The future belongs to organizations willing to invest in these solutions, thereby gaining competitive advantage through optimized inventory levels and enhanced customer satisfaction. Therefore, the question becomes not whether you can afford to implement these solutions, but whether you can afford not to.
Commport B2B Network Solutions for Supply Chains
The Complete Guide to Supply Chain Metrics
Top 30 Supply Chain Metrics & KPIs to Measure
Supply chain metrics are measurements used to assess the performance of a supply chain. These metrics can help businesses evaluate the efficiency and effectiveness of their supply chain operations, identify areas for improvement, and make data-driven decisions to optimize their supply chain. Examples of supply chain metrics include on-time delivery, inventory turnover, and order fulfillment rate.
Frequently Asked Questions
Lorem ipsum dolor sit amet, consectetur adipiscing elit. Ut elit tellus, luctus nec ullamcorper mattis, pulvinar dapibus leo.
Lorem ipsum dolor sit amet, consectetur adipiscing elit. Ut elit tellus, luctus nec ullamcorper mattis, pulvinar dapibus leo.
Accordion Content
Accordion Content
Accordion Content